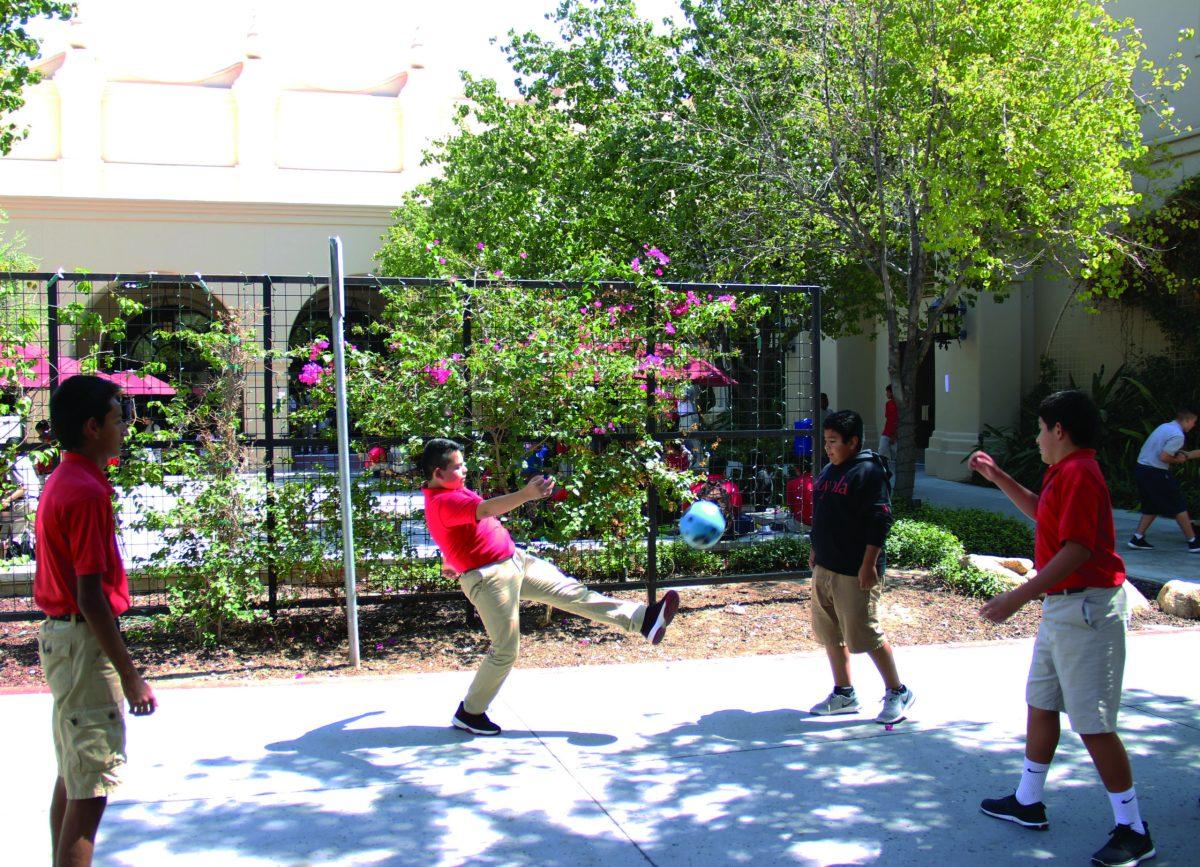
Photo by Josh Spano ’18 | Loyola students play with a soccer ball at lunch.
Frankie Pastor ‘20
THE ROUNDUP
Inside the Brophy community, Brophy and Loyola Academy have racially diverse student populations.
However, the two schools have different demographic makeups.
In the 2017-2018 school year, 24 percent of the student population at Brophy are of Hispanic/Latino background, while Loyola Academy is not.
“In some cases, it is an inverse of Brophy where the majority of Loyola come from Latino heritage,” said Principal Mr. Bob Ryan, when asked about the difference demography of Brophy and Loyola.
“The majority of the students have been of Latino heritage, but Loyola has had a variety of students from different backgrounds. ”
In a study by Maricopa County, 40 percent of the class of 2021 do belong to different ethnicities and races.
Among the 1328 students, there are a variety of races: Alaskan/American Indian (10 students), Asian (77 students), African-American (37 students), Native Hawaiian/Pacific Islander (12 students), White Caucasian (includes Hispanic/Latino, 1039 students), two or more races (131 students), and unknown (22 students).
Loyola Academy (a school within Brophy’s campus), does outscore Brophy of the enrollment differences.
With only 77 students attending, 97 percent of the school is of Hispanic/Latino ethnicity.
Of the different races, there are students who are Asian (2 students), African-American (4 students), Native Hawaiian/Pacific Islander (1 student), White Caucasian (includes Hispanic/Latino, 68 students), and two or more races (2 students).
“Loyola Academy has brought to Brophy the diversity of races and ethnicities,”stated President Mrs. Adria Renke, “There is also a diversity among the students at Loyola, with each one coming from different schools and backgrounds.”
The student population of Brophy and Loyola might continue to increase their number of diverse students, with every person who are enrolled into the schools every year.
